
24 Oct 2023
The value of integrated cost risk analysis


Now we’ve learned the basics of Earned Value Management calculations (see this blog), it’s time to introduce a new metric to define our project’s health.
As you’ve noticed all previous metrics and parameters were either percental (CPI, SPI, TCPI) or monetary/unitary (CV, SV). But what does a schedule variance of € 10.000 tell us? First, a delay expressed in monetary units is somewhat strange. Second, we will show later in this blog post that this metric is subject to a major fallacy. It is to be replaced with a more comprehensive one. Time for a change.
Since the start of EVM metrics in Project Management, it has become clear that the usefulness of SV and SPI become significantly less useful towards the end of the project. None of the above say anything about the delay/acceleration of your project’s finish. Both parameters use EV and PV as their components - see formulas in the previous blog post. As we can state, at the end of the project, EV and PV will become the same, namely BAC (unlike the AC, which can take any value at project closure). As a consequence, SV always becomes € 0 and SPI 100%. When approaching the end of the project, the relative variance between the two becomes very small. Since the thresholds are most likely contractually defined (SPI = 0.95 as acceptable), this parameter becomes misleading towards the end.
The need to predict the project’s outcome in time is very important. A new set of metrics was introduced by Lipke in 2003. [1]. Earned schedule reforms the common metrics SV€ and SPI% (referred to as SPI€) into SVt and SPIt expressed in time (days/hours/minutes/…) or a percentage of the elapsed time. This enables you to better predict not only the monetary outcome of your project, but also the delay/acceleration of your project. Underneath you find a simulation of project data which shows the evolution of Schedule Variance and Schedule Performance towards project closure. As well as the newly proposed metrics, SVt and SPIt.

Clearly visible is that in blue, the Schedule Performance Index SPI€ as calculated in Earned Value, recovers to 100% when the project continues after the planned finish date. In green the Schedule Performance Index in weeks which gives in this case a more transparent and intuitive information.
Actual time (AT) is the date of reporting or Data Date (DD). Let’s say the table underneath shows your project’s PV and EV. In the example above, your AT is 3 because it’s day 3.

Earned Schedule (ES) the date when your PV curve has the EV value. This means the day that the percentage completion should have been as far as it is on AT. The Actual Time is day 3, your Earned Schedule is 2 because on day 2, your PV equals your EV today. [2]
The formula for Schedule Variance in time is like the Schedule Variance in €. It’s not your Earned Value minus the Planned Value, but the Earned Schedule minus the Actual Time.
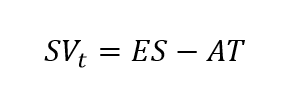
In our example above, the SVt is – 1 days, which means you’re 1 day behind schedule.
The Schedule Performance Index in time tells the same story, it’s the ratio of the Earned Schedule and Actual Time.

In our example above, the SPIt is 66%. Same interpretation rules apply than in with the normal SPI and CPI. If the value is below 100%, you’re UNDERperforming. This means the project evolved at a 66% efficiency compared to what we had planned.
In Fig. 2 you can see the graphical representation of what an Earned Schedule analysis graph could look like. This clears up the entire definition of Earned Schedule to me. Instead of looking to the vertical difference between the PV curve and the measured EV, we project the EV onto the PV curve to gain insight in the time we have lost/won.
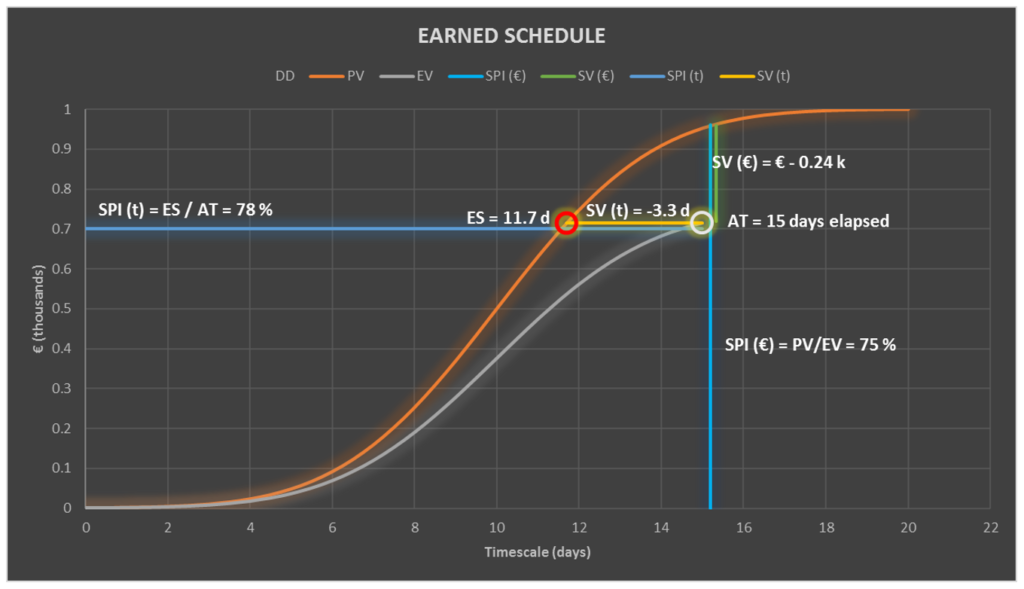
While Earned Value focuses on the differences of Planned Value and Earned Value along the vertical axis, Earned Schedule focuses on the differences along the horizontal axis Time.
The forecasting techniques in Earned Value Management focus on de Estimate At Completion (the actual costs when the project is completed). EVM does not forecast the estimated finish date, since EVM is lacking good schedule indicators. With Earned Schedule, it is now possible to predict the expected finish date with similar techniques as we did for Estimate At Completion. This, together with how you set up a good Earned Value/Schedule file in Excel, will be subject for a future blog.
Earned Schedule calculations are easier to understand and don’t have the pitfalls which SV€ and SPI€ have. They resemble the actual amount of time you’ve lost during the realization of your project to make the finish line. However, calculations on ES are not always easy and often not present in many commercial planning packages; a wit Excel file can solve most problems. Stay tuned for more Earned Value magic.
References and footnotes
[1] Lipke, Walt. "Schedule is Different,” The Measurable News, March & Summer 2003
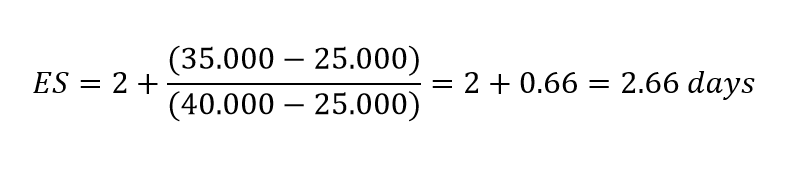
[2] Note: for EV values you cannot simply find in your PV table, we use linear interpolation using the formula underneath.

with T: the highest date where PV does not exceed your EV. Let’s say our EV is € 35.000. Then T=2 so that
Note: this blog was written by By Niels Ligtvoet and Jelmer Wagenaar
This blog is part of our Earned Value Series: